
Where Korea’s Luxury Resale Inventory Is Going Overseas—and What the Data Shows
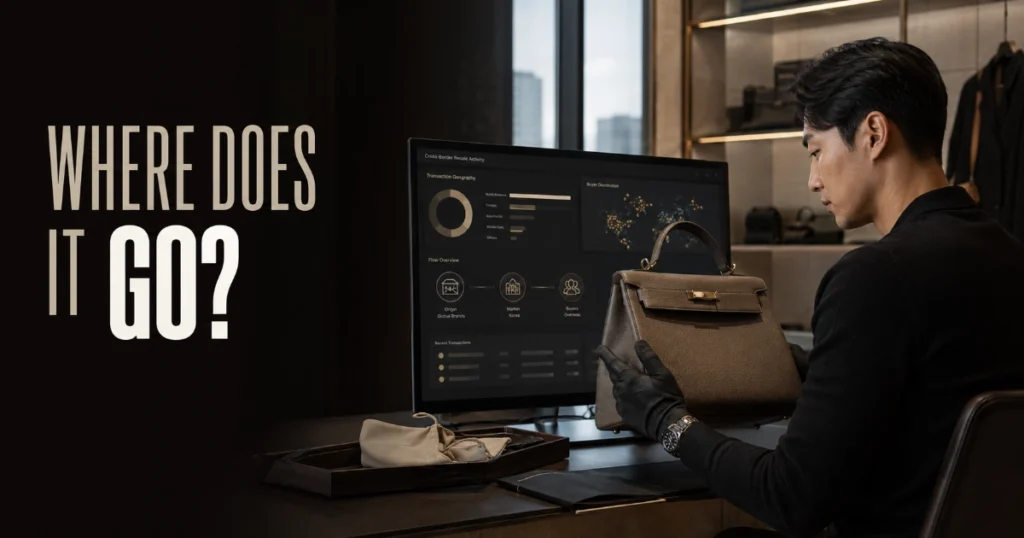
Korean luxury resale data can show where high-value secondhand inventory circulating through Korea is being bought overseas, but the phrase needs careful definition.
A Louis Vuitton trunk sold from Korean resale inventory to a U.S. buyer is not a “Korean luxury brand export.” The brand may be French, the resale inventory may be located in Korea, and the buyer may be in North America. Those are three different facts.
I learned to separate those layers after seeing the label “K-luxury” used around transactions involving brands such as Louis Vuitton, Hermès, and Rolex. At first, the wording can sound as if the data is about Korean luxury brands. Looking at the actual items changed how I read it. I now ask where the inventory is circulating and where the buyer is located before I attach meaning to the brand’s nationality. I care more about the route the item takes than the nationality suggested by a headline.
The strongest evidence here comes from Bunjang’s 2025 luxury-resale dataset. It is useful platform data, but it remains platform data. DecodingKorea’s broader guide to platform data versus market-wide claims explains why that boundary matters.
What Bunjang’s 2025 Luxury Data Actually Measures
Bunjang’s 2025 K-Luxury Secondhand Report, released in March 2026, analyzes transaction data from the platform for 2025. It includes high-value domestic transactions, category transaction value, luxury-brand preference data, newly listed items, and overseas transaction geography.
The report also uses marketing language around liquidity, asset value, and “safe haven” brands. Those descriptions should not be treated as equivalent to the underlying transaction data.
I have run into this problem often when reading company reports: observed numbers and the company’s interpretation can appear in the same paragraph and start to feel like one kind of evidence. Over time, I have become more deliberate about separating them. A transaction value, transaction count, or measured share is data. Calling a product a “liquid asset” or a “safe haven” is an interpretation layered on top of that data. I separate the number from the narrative used to sell the number.
North America Took 51.7% of Reported Overseas Luxury Value
The most important cross-border figure in the report is geographic. Bunjang reported that North America accounted for 51.7% of the overseas export value in its luxury-resale dataset.
That denominator is essential. The 51.7% figure does not describe the global luxury resale market, Korea’s entire luxury resale export market, or all Korean resale platforms. It describes Bunjang’s analyzed overseas luxury-resale export value.
Large percentages are exactly where I have learned to slow down. A figure such as 51.7% immediately attracts attention, but its meaning changes completely depending on whether the denominator is worldwide market value, one company’s overseas transactions, transaction count, or transaction value. I now ask “51.7% of what?” before I ask whether the percentage is large. I check the denominator before I interpret the ratio.
That discipline keeps the claim narrow: the report gives us a strong North American signal inside one platform’s luxury cross-border dataset, not a national market share estimate.
High-Value Items Are Already Crossing the Border
Bunjang gave specific U.S. transaction examples, including a Louis Vuitton Mirror Monogram trunk at about KRW 6.5 million and a visvim shacket in the KRW 5 million range.
These examples show that high-value inventory can move from Korea-side resale listings to overseas buyers. They do not establish an average export price, median transaction value, or typical U.S. buyer spend.
I have learned to treat headline transactions carefully for the same reason. When a report highlights a multimillion-won watch, bag, or trunk, the exceptional number is memorable. But a memorable transaction is not automatically representative. I now read it as evidence that a transaction of that scale occurred, not evidence that most buyers spend at that level. The most visible deal should not become the market average in my head.
High Domestic Transaction Prices Tell a Different Story
The same Bunjang report listed high-value domestic transactions including a Rolex GMT-Master II at KRW 51.5 million, an Hermès Mini Kelly at KRW 31.2 million, and an Hermès Birkin 25 Etoupe at KRW 29.22 million.
Those examples support a different conclusion from the North American share. They show that Korea-side platform inventory includes extremely high-value items. They do not show that those particular items were exported.
This is where the inventory-route model becomes useful:
| Layer | Question |
|---|---|
| Brand Origin | Where is the brand from? |
| Korea-Side Inventory | Is the secondhand item circulating through Korea? |
| Korean Resale Platform | Where is the item listed or transacted? |
| Overseas Buyer | Where is the buyer located? |
| Demand Geography | Which region accounts for transaction value? |
Brand origin, inventory location, and buyer geography are three different things.
Jewelry’s 381% Growth Is Not an Export Growth Rate
Bunjang reported that jewelry-category transaction value increased 381% year over year. That metric should remain attached to both its category and its measurement type.
It is not evidence that luxury exports increased 381%. It is not a 381% increase in transaction count. It is not a Korea-wide luxury-market growth rate.
The same report mentions 39 million newly listed items. That is a listing figure, not a completed-sales figure. The report also refers to a 52% transaction growth rate, but the public release does not define that metric clearly enough to make it a central number here. Metric definition comes before growth interpretation.
Korea Can Be a Resale Route Without Being the Brand’s Country of Origin
The most useful interpretation of the overseas data is not that Korea is exporting “Korean luxury brands.” It is that globally branded luxury inventory can circulate through Korea’s secondary market and then be redistributed across borders.
That makes Korea a possible resale route or redistribution point for inventory that may have originated with brands from France, Switzerland, Japan, the United States, or elsewhere.
This vertical also sits inside the broader pattern of overseas demand for Korean secondhand goods. Luxury is one high-value category inside that wider cross-border resale system, not a substitute for the whole market.
Specific platform data can make that route visible, but I have also learned not to let specificity create false confidence. The more concrete a company dataset looks, the easier it is to treat it as the whole market. Different resale platforms can have different users, categories, transaction systems, and inventory mixes. The more precise the platform data is, the more precisely I state its scope.
Global Bunjang Is Growing, but That Is a Broader Dataset
Bunjang’s August 20, 2026 transaction update gives more recent context for the cross-border channel. The company reported that Global Bunjang transaction count was 2.2 times the prior-year level, transaction value was 2.4 times the prior-year level, and transactions had occurred across roughly 200 countries over the previous year.
Those figures are not luxury-specific. They describe Global Bunjang across categories. They therefore support a background conclusion—that the same cross-border resale channel is expanding—but not the claim that luxury transactions themselves grew 2.2 or 2.4 times.
This is a two-dataset problem:
- Dataset A: 2025 luxury-specific report — luxury examples, jewelry transaction value, preference data, and overseas luxury-value geography.
- Dataset B: August 2026 global-platform update — all-category transaction count, transaction value, and geographic reach.
Dataset A and Dataset B should not be merged into one luxury-growth claim.
High Transaction Prices Do Not Establish Investment Value
Luxury resale data can easily drift into investment language because expensive items, rapid sales, and large transaction values look financial.
I have felt that pull when reading high-price resale examples. A large transaction can make the item look like an asset with a predictable return. But purchase price, condition, fees, timing, and future demand can all differ. One past sale cannot establish what the next buyer will pay. That is why I separate “What did this item sell for?” from “Will this item produce a future return?” I do not turn transaction history into an investment forecast.
This article therefore does not adopt Bunjang’s “liquid asset” or “safe haven” wording as an independent factual conclusion.
Buyer Questions Outside the Inventory Route
The current evidence cannot establish why North American buyers purchased from Korea, whether Korean prices were cheaper, whether currency movements affected demand, or whether authentication infrastructure caused cross-border transactions.
It also cannot tell us the total size of Korea’s luxury resale market, the total value of Korea’s luxury resale exports, North America’s share across every Korean platform, average overseas transaction prices, future resale returns, or whether the 51.7% geographic share will persist.
High-value transactions naturally raise questions about verification, but detailed authentication belongs in DecodingKorea’s separate guide to authentication infrastructure in high-value resale.
Map the Item’s Geography Before Naming the Demand
Before turning a resale statistic into a market claim, check seven things:
- Platform: Which company generated the data?
- Category: Is the dataset luxury-specific or all-category?
- Metric: Is it transaction value, transaction count, listings, or another measure?
- Inventory location: Where was the secondhand inventory circulating?
- Buyer geography: Where did the overseas transaction go?
- Time period: Which reporting period does the number describe?
- Market boundary: What larger claim remains unsupported?
Bunjang’s data gives us a concrete finding: North America accounted for 51.7% of the overseas export value in its 2025 luxury-resale dataset. That is meaningful evidence of cross-border demand through one Korean resale platform.
It is not a measurement of Korea’s entire luxury resale export market. The distinction is what makes the data useful rather than misleading.
Four Geographies Inside One Luxury Resale Transaction
| Geography | Question | Example of a wrong shortcut |
|---|---|---|
| Brand origin | Where is the brand historically or corporately based? | Treating origin as the seller’s market |
| Inventory location | Where is the specific item before sale? | Assuming inventory location proves product origin |
| Seller market | Where does the seller participate in the transaction? | Treating seller location as buyer demand |
| Buyer destination | Where is the item sent or the buyer recorded? | Calling this demand for Korean brands |
Fictional inventory route
A French luxury bag can be held by a seller in Korea, listed through a Korean platform, and shipped to a buyer in Canada. The transaction is evidence of luxury inventory moving from Korea to Canada through that platform. It is not evidence that a Korean-origin brand gained Canadian demand.
This geography test is what separates DK2-17 from the designer-fashion question in DK2-16. Here the object of analysis is the route of inventory, regardless of where the brand originated.